
Living standards are set to fall by 7% in the UK over the next two years, according to the Office for Budget Responsibility (OBR) – the government’s independent economic forecaster – but some areas will be hit harder than others.
Generally, when living standards fall it means people can afford fewer (or less expensive) goods and services. It is happening now because real household disposable income (the money you have left after taxes and inflation adjustments) is dropping, due to an expected decline in the UK’s real GDP per capita.
In addition to this squeeze on disposable income, the UK is also experiencing rising interest rates and falling house prices. This will tip the economy into a recession lasting just over a year from the third quarter of 2022, according to the OBR.
Compounding these developments, unemployment is expected to rise by more than half a million people – from 3.5% to 4.9% of the working population – in the third quarter of 2024. This will have long-term implications for real disposable incomes, which the OBR believes will still be 1.5% smaller than pre-pandemic levels by 2027.
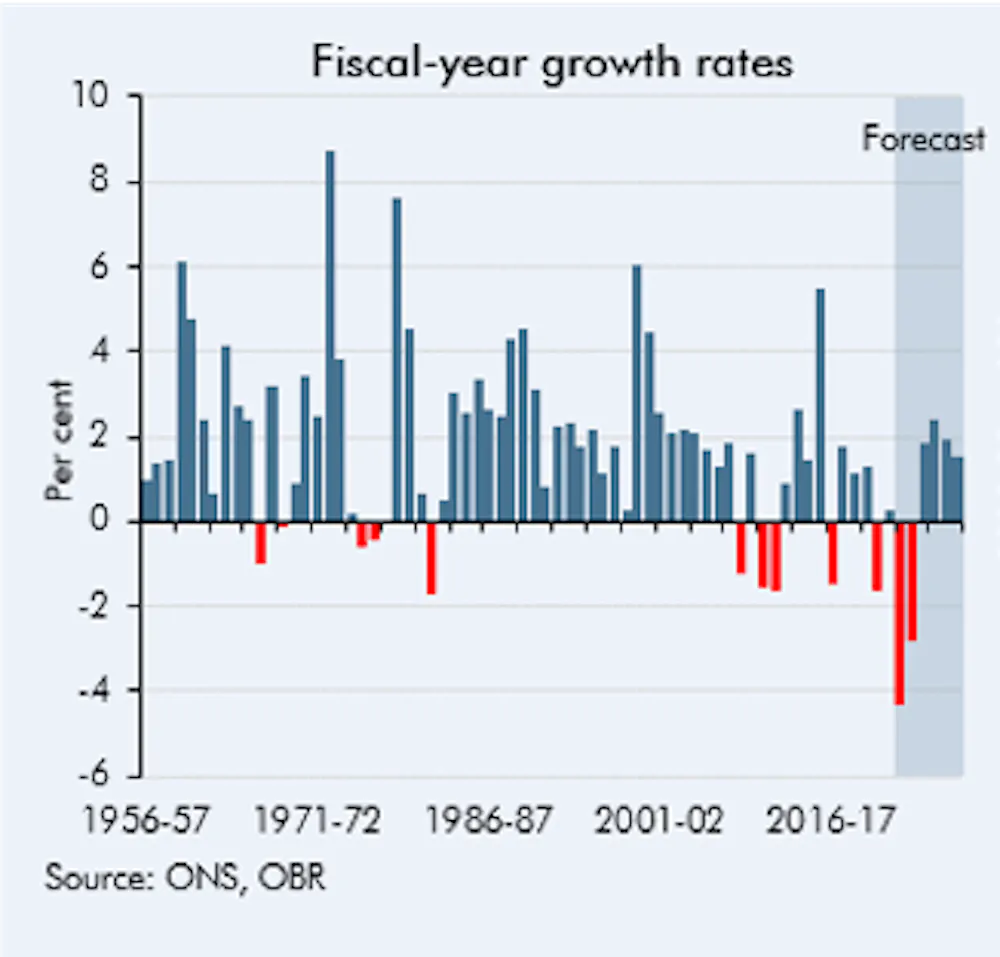
Falling UK living standards
Office for Budget Responsibility (OBR) Economic and Fiscal Outlook, November 2022
As the chart above shows, living standards are set to fall by 4.3% in 2022-23 and 2.7% in 2023-2024, for a cumulative fall of 7% between 2022 and 2024. This will wipe out the previous eight years of growth in living standards and is the biggest fall on record.
Even with recent changes to the UK tax code so that more of us will now pay additional taxes, and stalling GDP growth, inflation is the main driver of this fall in living standards. But it’s important to remember that the expected 7% drop is an average figure. In reality, the fall will be much greater for some households and regions than others.
The uneven effects of price inflation
The annual inflation rate up to October this year was 11.9% for low-income households and 10.5% for high-income households, compared with an all-households (average) rate of 11.1%. This is because energy and food costs – the major drivers of UK inflation right now, as the chart below shows – make up a greater proportion of household budgets for the less well off.
Rising prices, particularly for food and energy
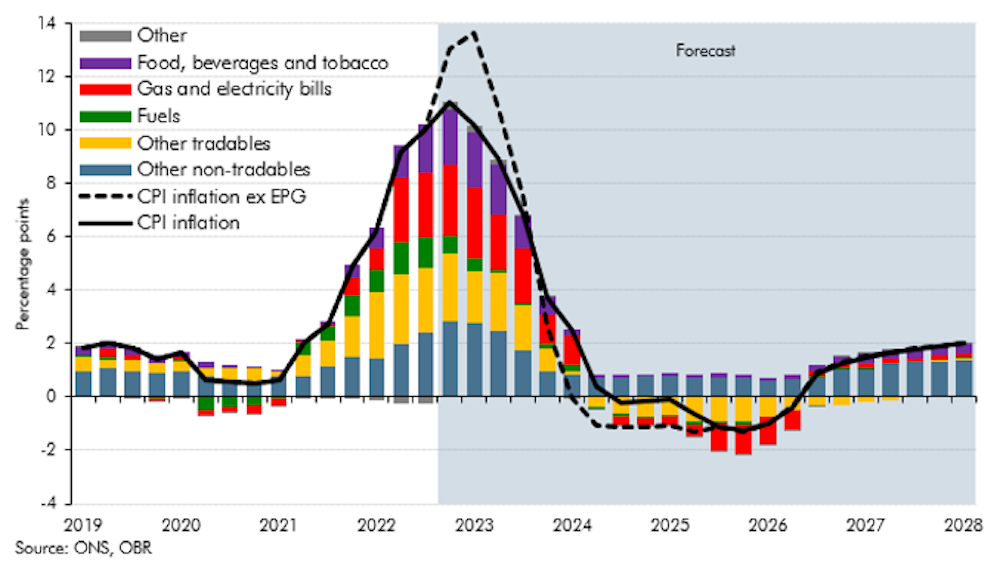
Office for Budget Responsibility (OBR) Economic and Fiscal Outlook, November 2022
Overall, inflation should is likely to peak this year at 2.5% less than expected before the government’s energy price guarantee scheme was launched in September. Inflation should start to fall from next year and become negative from 2024 to 2026, according to the OBR, before returning to the Bank of England’s target of 2% between 2026 to 2027. But its impacts will live on, particularly in worse-off areas.
‘Left-behind’ areas will be harder hit
As well as facing a bigger fall in living standards than the better off, poorer households are usually in “left-behind” regions – worse-off places that will be affected more by falling living standards.
For starters, inflation is higher in the north than in the south-east of the UK. Burnley, Blackburn, Glasgow and Blackpool are the worst affected, with inflation above 11% in all four places. This is more than 2% higher than in cities that are further south such as London, Cambridge and Reading.
Inflation is higher in the north compared to the south-east of the UK
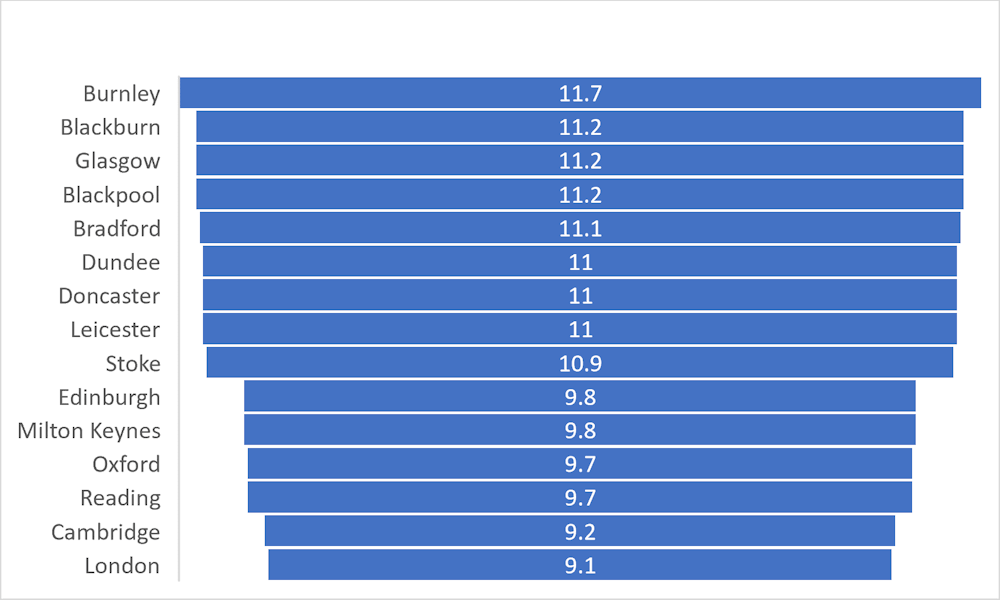
ONS, HMRC (PAYE), Centre for Cities’ calculations
Unemployment will also hurt these regions more because they are often less economically active, such as post-industrial areas in the East and West Midlands and north of England. More than a quarter (26.7%) of people living in left-behind neighbourhoods are income deprived, compared to 12.9% in England as a whole. Plus, real household disposable incomes are lower and unemployment is higher in these parts of the country. For example, even though the national unemployment rate in the UK is 3.5%, it is currently 4.9% in the West Midlands. The economic inactivity rate is also typically higher in left-behind regions.
The UK is already the second-most unequal G7 country after the US. This combination of higher inflation and economic inactivity, and lower disposable incomes and employment rates are set to make inequality in the UK worse, with left-behind areas feeling the brunt of this.

enciktepstudio / Shutterstock
Addressing inequality in UK living standards
One way to increase the real household disposable incomes in these harder-hit regions would be to reduce the tax burden of working households in left-behind regions. This targeted approach could also stimulate growth for the small and medium enterprises in these regions that have already started to report falling demand as a result of the economic downturn.
Typically, lower- and middle-income earners tend to spend more of their income within their communities as opposed to saving it. Research shows that tax reductions could be further targeted at workers in these tax bands living in these areas.
Corporate tax incentives for investments that benefit left-behind areas can also create better-paid jobs and stimulate growth in these communities. This should be for both small and medium enterprises and large multinationals. Improving the infrastructure in these regions would also make it easier to do business and reduce the reliance on car travel.
The government’s current “Levelling Up ” agenda is clearly not working and falling living standards will only make things much worse. Measures such as these could help left-behind areas catch up with other parts of the UK.
by : Tolu Olarewaju, Economist and Lecturer in Management, Keele University
Source link